 Each month I write The Big Picture newsletter for our clients, where I outline my current take on the market and its likely direction, as well as the performance of the funds we currently hold in our portfolio.
In this post, we'll look at the market's behaviour in November and where it might head next.
You can find out more in December's edition of The Big Picture monthly newsletter, which is now available – you can download your complimentary copy here.
Let the market tell you what's happening
The dramatic falls that the markets experienced just after the US election came to a conclusion resulted in many uneducated investors selling at what looks like precisely the wrong time. It’s very easy for investors new to the markets to get spooked out when the market is falling and sell on emotion.
Rather than going off how you feel, our take is to let the market tell you what’s really going on. You can do that by carefully studying the daily price and volume behaviour of the main indexes and leading stocks. By doing that each and every day, you’ll eventually be able to determine whether the behaviour was healthy or unhealthy, helping you to make better-informed investment decisions.
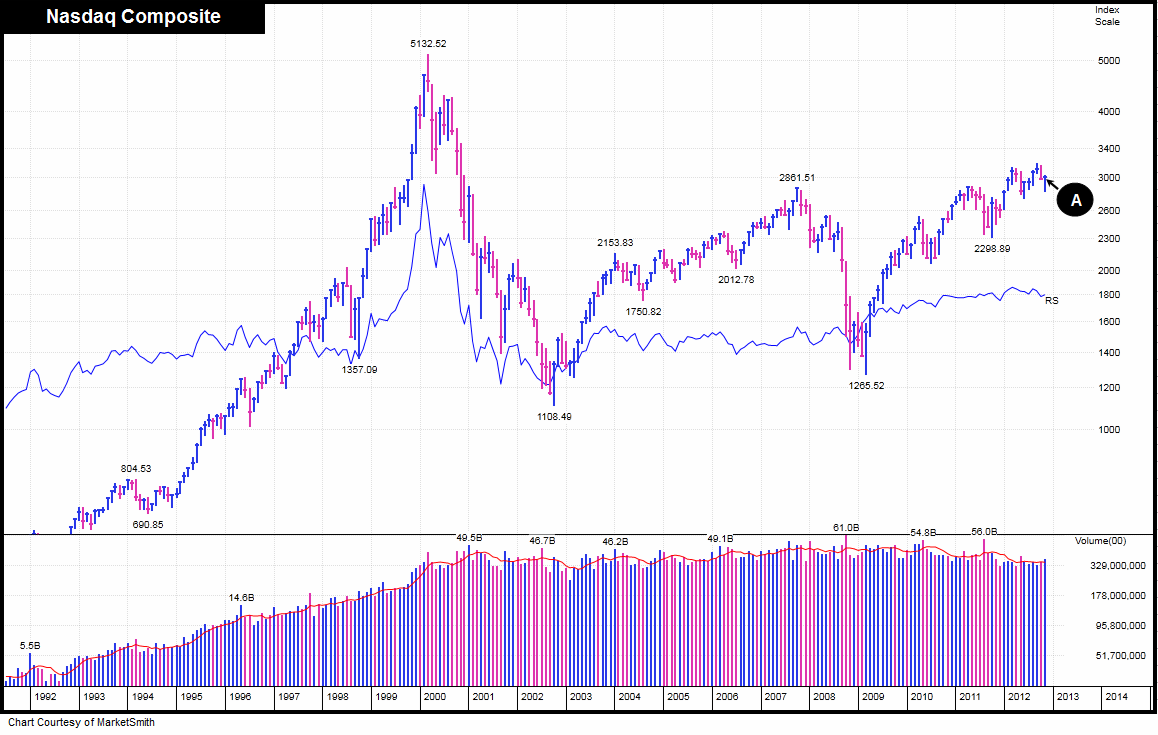
In November, the major indexes experienced steep falls at the start of the month, followed by a sharp rally in the final two weeks. This is what you call a bullish reversal (Point A) and even though the markets didn’t make huge gains, it should still be seen as a constructive month.

The best months for making money
Historically November, December and January have proved to be the best months for making money in the market and because November didn’t see large gains, December and January could turn out to be good profit generating months for market participants who are fully invested.
The financial media continue to tell us that the world is about to collapse and the latest buzz word is ‘the fiscal cliff’. However as you will see in this edition, we tend to ignore the opinions of others and instead stick to the facts. We believe it’s best to let the market tell you what’s going on by simply looking at the actions and behaviour of institutional investors. We look to see if they are buying or selling.
It’s best to try to get ‘in sync’
As you are aware, the big players control approximately 75% of the market’s future direction, and so it’s best to try to get ‘in sync’ with their trading activity or it’s going to feel like trying to swim against a strong current. If you don’t get in sync, you could get hurt. We like to see if the 800 pound gorilla investors are buying, because when they do it strengthens the market. However, if they are selling it weakens it. The other thing we like to keep a close eye on is the action and behaviour of leading stocks.
Why? If the leaders are acting weaker than the general market it’s negative. However when leaders are outperforming the market it’s positive. It’s simple really. When leaders are underperforming, then the market is more likely to head lower, and if leaders are outperforming, then the market is likely to head higher. Are leaders outperforming right now? Yes!
Bull market? Bear market? Where are we?
Many media sources continue to suggest that the stock market is in a bear market cycle. However you can’t argue with facts. Take a look at this five year chart of the Nasdaq Composite and you’ll see that the bull market that began in March 2009 (Point B) remains intact.
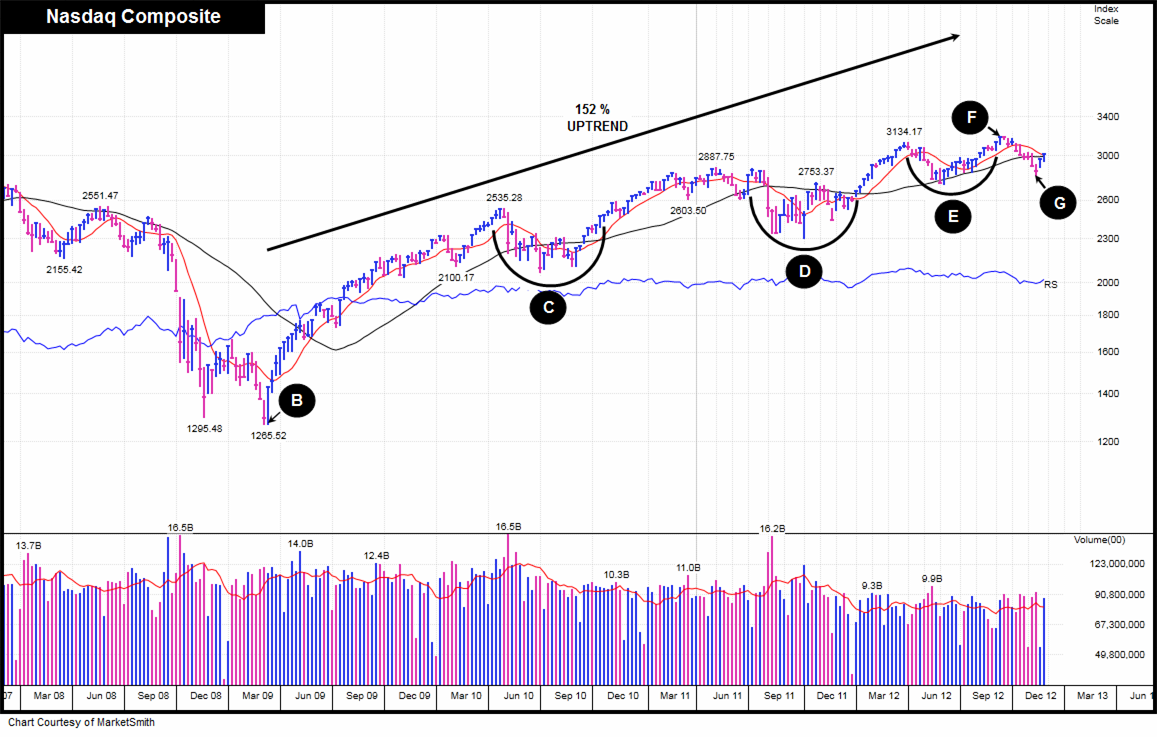
Since the uptrend began, the Nasdaq has made an impressive 152% return. However, to make that gain it has had to experience three challenging corrections.
The first correction (Point C) occurred from April to November 2010. The second (Point D) is a correction that started in May 2011 and ended in January 2012. The third (Point E), began in late March and ended in September 2012 (Point F). Just after that correction ended, the market has corrected again and it looks as if this retracement found a bottom about two weeks ago on the 16th November (Point G).
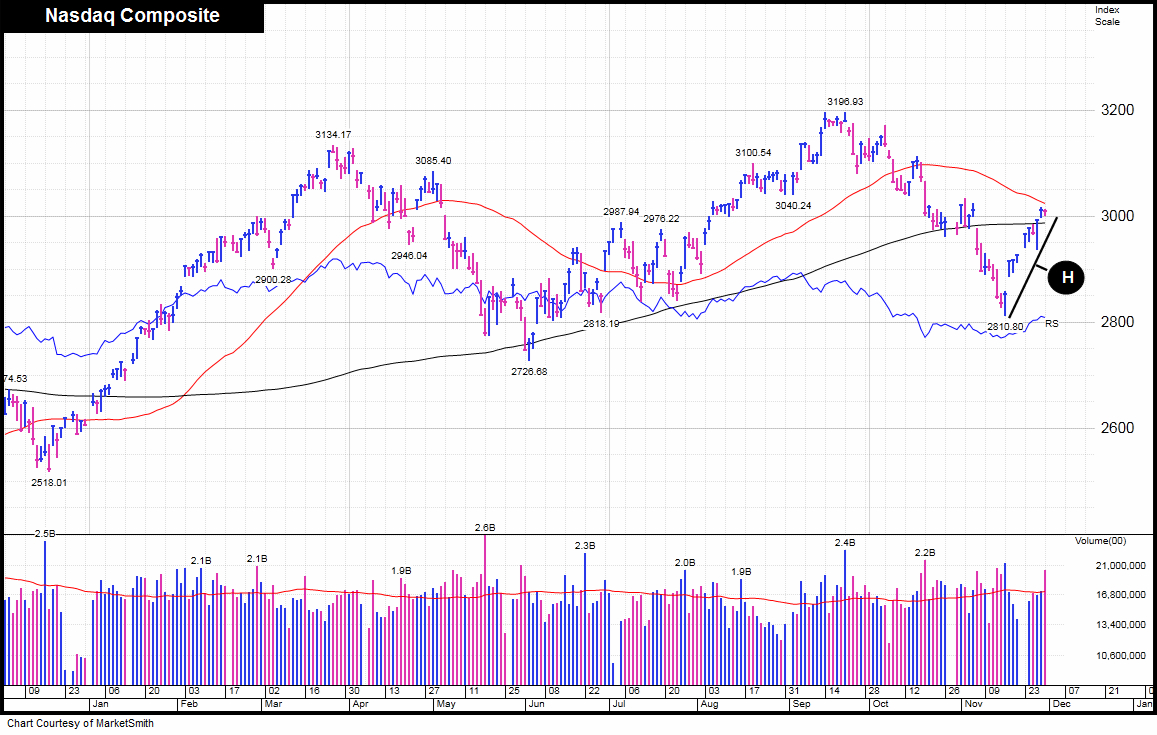
8 days of gains in the last 10 days = new uptrend
As you can see, on the 12 month chart of the Nasdaq Composite the US tech index has gained eight times in the last ten trading sessions (Point H), helping to confirm that this latest correction has probably found a floor and that we are now on the way back up.
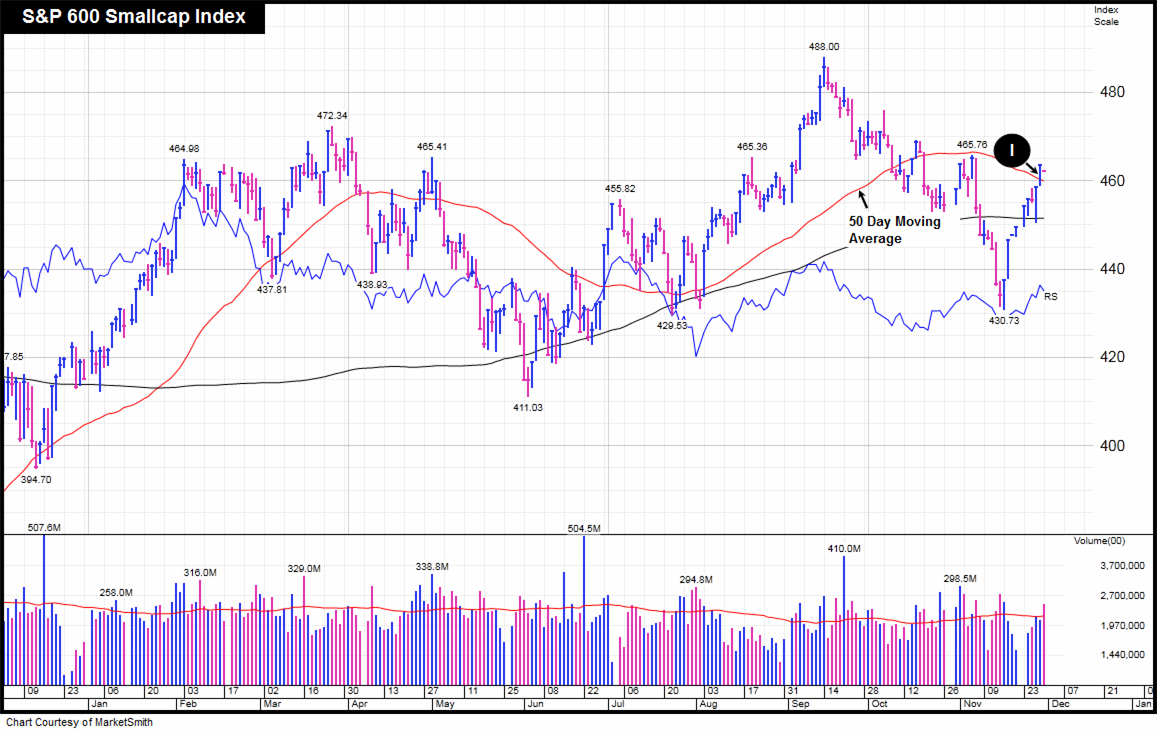
Back above its 50 day moving average = healthy behaviour
Next take a look at the S&P 600’s recent action. Notice on Thursday 29th November, the small cap index bullishly jumped back above its 50 day moving average (Point I) helping to confirm that the market has probably clicked back into gear.
To download your free copy of The Big Picture, please just click here.
As always, if you have any questions or thoughts on the points I've covered in this post, please leave a comment below or connect with us @ISACO_ on Twitter.
About ISACO
ISACO is a specialist in ISA and SIPP Investment and the pioneer of ‘Shadow Investment’, a simple way to grow your ISA and SIPP. Together with our clients, we have £57 million actively invested in ISAs and pensions***.
Our personal investment service allows you to look over our shoulder and buy into exactly the same funds as we are buying. These are investment funds that we personally own and so you can be assured that they are good quality. We are proud to say that by ‘shadowing’ us, our clients have made an annual return of 17% per year over the last three years** versus the FTSE 100’s 7.9%.
We currently have close to 400 carefully selected clients. Most of them have over £100,000 actively invested and the majority are DIY investors such as business owners, self-employed professionals and corporate executives. We also have clients from the financial services sector such as IFAs, wealth managers and fund managers. ISACO Ltd is authorised and regulated by the Financial Services Authority (FSA). Our firm reference number is 525147.
*Cumulative return 31st December 1997 - 31st December 2010. Stephen Sutherland 93.3%, Nasdaq Composite 68.9%, FTSE 100 14.6%.
**31st December 2008 - 31st December 2011.
***15th November 2012: Internal estimation of total ISA and pension assets owned by ISACO Investment Team and ISACO premium clients.
ISACO investment performance verified by Independent Executives Ltd.
Look over our shoulder and shadow our ISA and pension investing >>
To download our Shadow Investment brochure >>
To start your 14 day free trial of Shadow Investment >>
To discover 'A Golden Opportunity' >>